

Statistical Reports in Vision Helpdesk
A report is a document that presents information in an organised format. This format can be defined as per requirement and it helps target a specific audience and purpose. Reports help provide all the necessary information in short, sharp and concise format. The data needs to be clear and well-structured to communicate across the details.
The reports module in the staff portal can be accessed through the launcher icon

in the inbox. Here, you can select reports module from the list of modules available in the system.

Once you click on this option you will be redirected to the reports overview page. If you have multiple domains you will first need to check and update the domain name before proceeding further. In reports overview you will find multiple tabs on the screen detailing different reports available in the system.
The second tab is the statistical reports tab. You can click on this option and a whole array of various components available in the system segregated as per their utility is displayed on the screen. Statistical reports provide raw data that is straightforward to analyse. These reports are primarily used for in-depth analysis of the situation. This report provides data to analyse and draw conclusions.
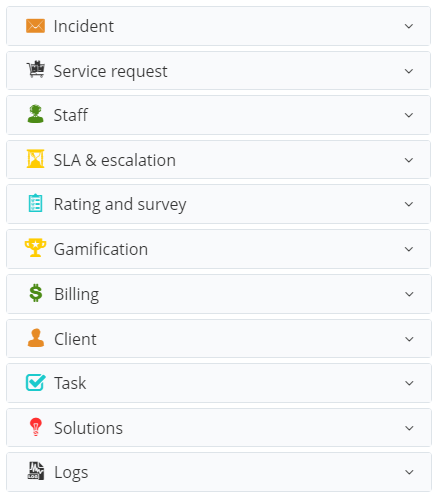
In statistical reports you will find reports based on incidents, staff, clients, billing, etc. Under each of these components you will find various sections based on which the reports are drawn.
For example, suppose you have a staff that responds back to tickets submitted by your clients. When a client query is raised as a ticket in the system, SLA is applied on it and the staff is expected to respond back and resolve the query before the status is changed to overdue. Suppose you wish to draw a report based on the first response time, i.e. the time required by your staff members to respond back to the client queries. As it is a function regarding incidents, reports related to its functionality can be found under the incident drop down menu.
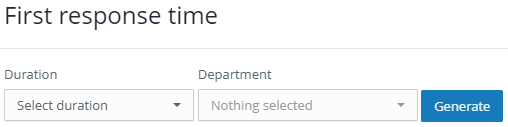
From the incident option, when you click on the drop down arrow you will find various reports that can be drawn. In this list you will find the first response time report. When you click on this option, you will be redirected to a page where the details of the report will be displayed. Here, before drawing the report, the system will permit you to select the duration and department for which you need to create the report.
As a report is generated you will be able to see the details of the reports displayed on the screen. Here you can see all the details of the ticket like the subject, date of creation, reply date and response time. Whether the SLA was maintained or not and the average of total response time, etc. These reports are useful to check the accountability of the staff and measure the productivity.
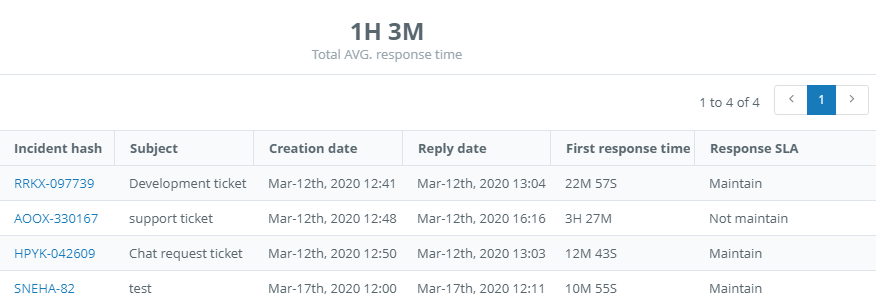
(Total average response time is the addition of the total response time of all the tickets received in the specified duration divided by the total number of responses received from the clients)

Schedule a Report
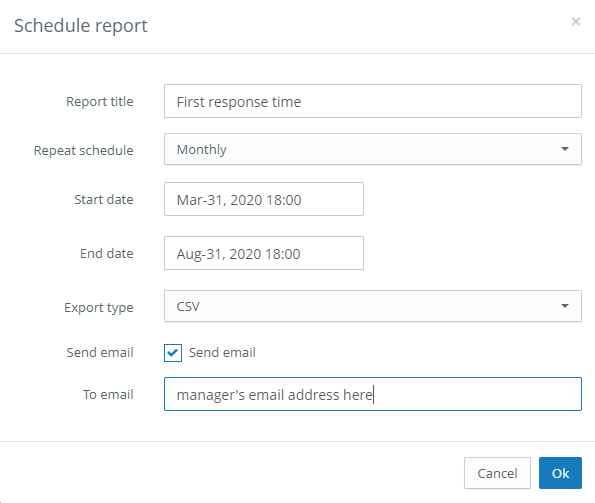
After a report has been generated, you can also select to schedule the same kind of report for a future date. In the repeat schedule you can select a daily, weekly, monthly, quarterly or yearly report. You can also select last month's report if you wish to create a report for the past month. You can also create a provision where these reports will be directly sent on the email address of your supervisor or manager.
Export a Report
When the report has been generated VHD also provides an option where you can export this report from the system in three file formats, namely CSV, HTML and XLSX. You may also send this report in your desired file format to the email address of your choice.
